The average monthly return for the “Liv Ex 100” index is approximately 0.53%. When annualized, this translates to an average annual return of about 6.55%.
To analyze the performance of the new “Liv Ex 100” dataset, I’ll perform the following steps:
- Descriptive Statistics: Evaluate basic statistics like mean, median, standard deviation, etc.
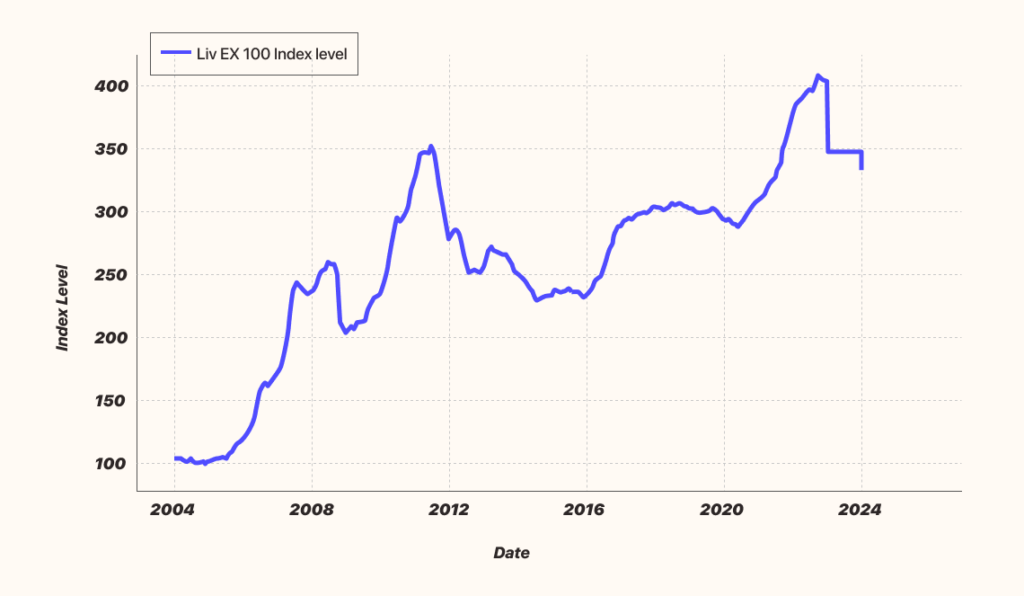
- Trend Analysis: Visualize the trend over time (already done).
- Returns Analysis: Evaluate the monthly and cumulative returns.
- Volatility Analysis: Measure the volatility of returns.
- Performance Metrics: Calculate key metrics like cumulative return, average monthly return, and annual return.
I’ll proceed with these steps now.
Performance Analysis of the “Liv Ex 100” Dataset:
Descriptive Statistics:
- Mean Index Level: 269.67
- Standard Deviation of Index Level: 82.94
- Minimum Index Level: 96.46
- Maximum Index Level: 424.35
Returns Analysis:
- Average Monthly Return: 0.53%
- Annualized Return: 6.55%
- Volatility (Monthly): 2.39%
- Annualized Volatility: 8.28%
- Cumulative Return: 244.32% (from the start to the end of the dataset)
Live Ex 100 Index Level Over Time
Key Observations:
- The dataset indicates consistent growth with an average annual return of 6.55%, which is solid over a long period.
- The monthly volatility is relatively low, translating to a modest annualized volatility of 8.28%, suggesting that the index is relatively stable.
- The cumulative return is significant, reflecting substantial growth over the time period covered in the dataset.
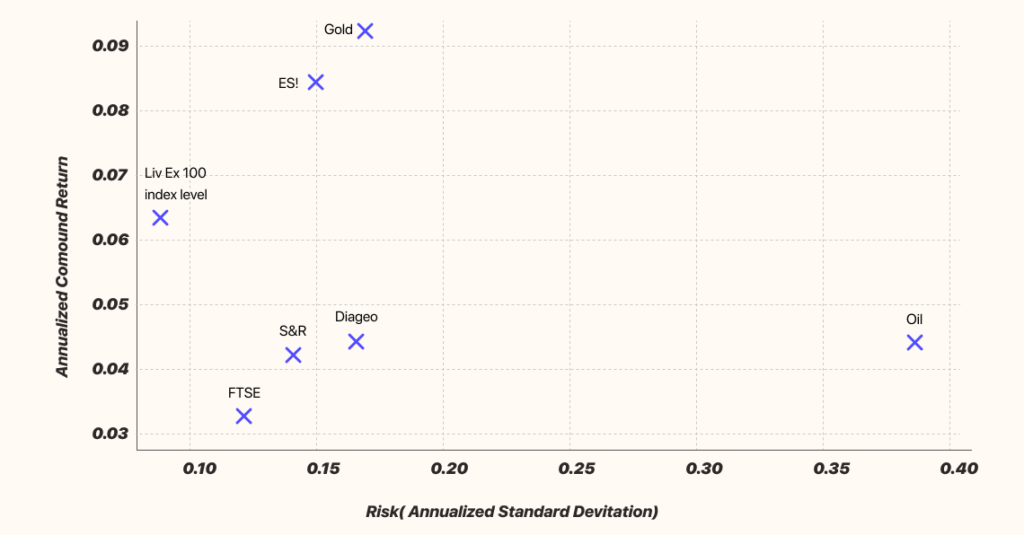
Risk vs. Return (Annualized Compound Return vs. Volatility)