CORRELATION
& VOLATILITY
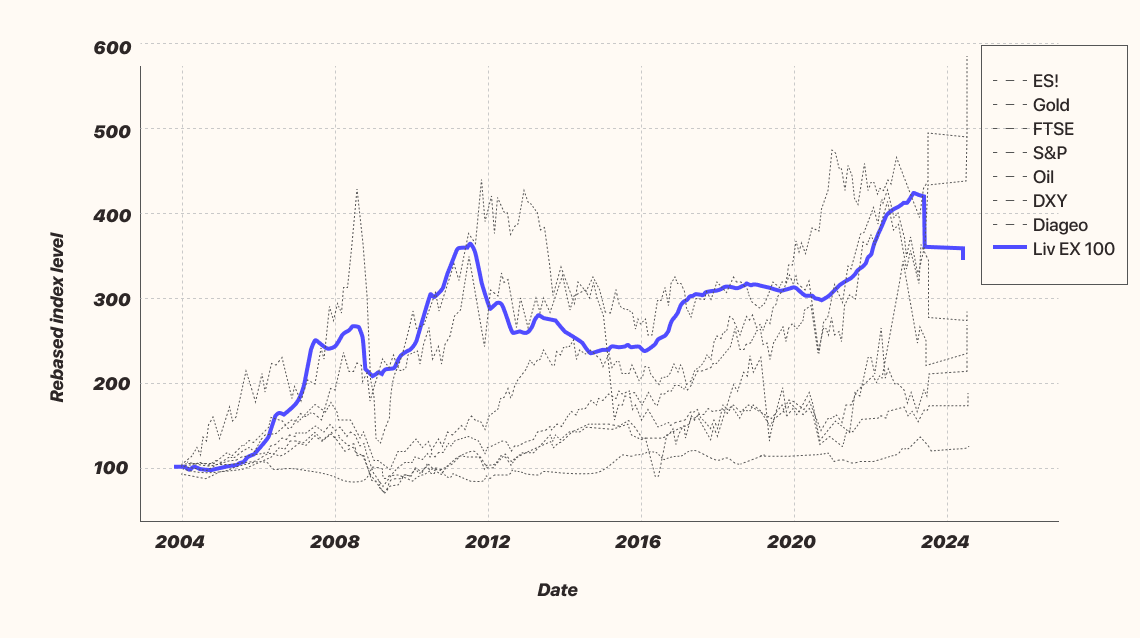
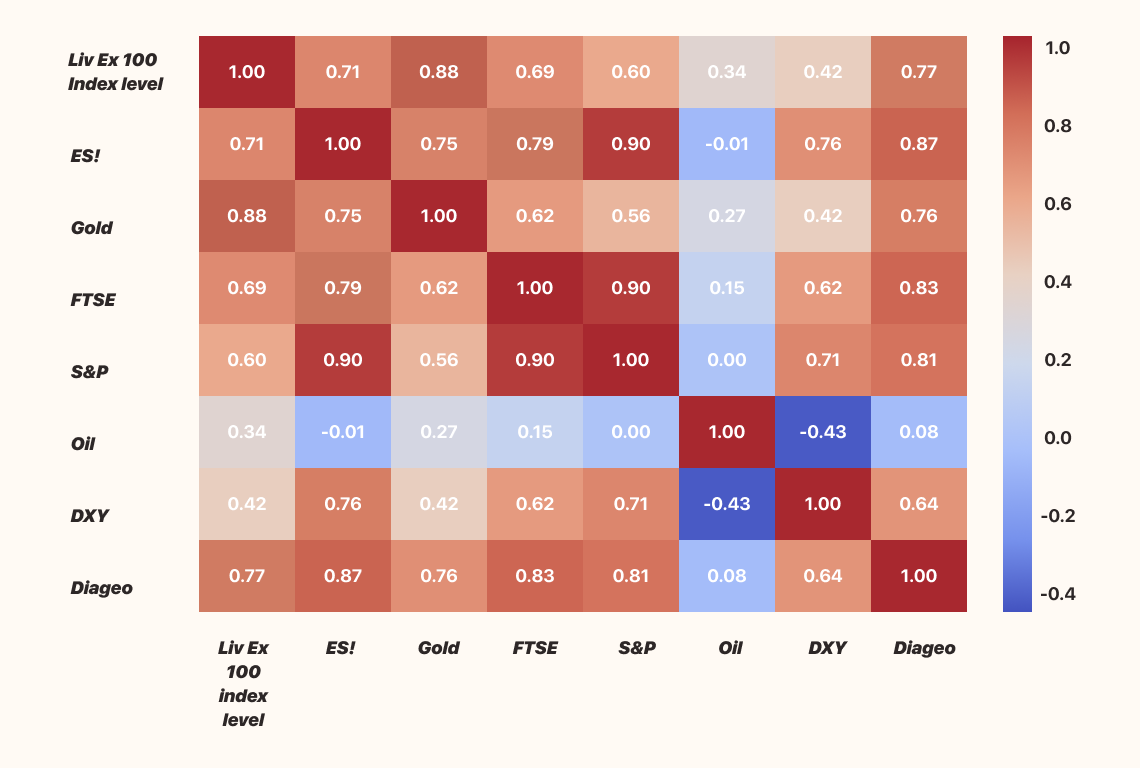
The correlation matrix shows how each index or asset is related to the others. Values close to 1 indicate a strong positive correlation, while values close to -1 indicate a strong negative correlation.
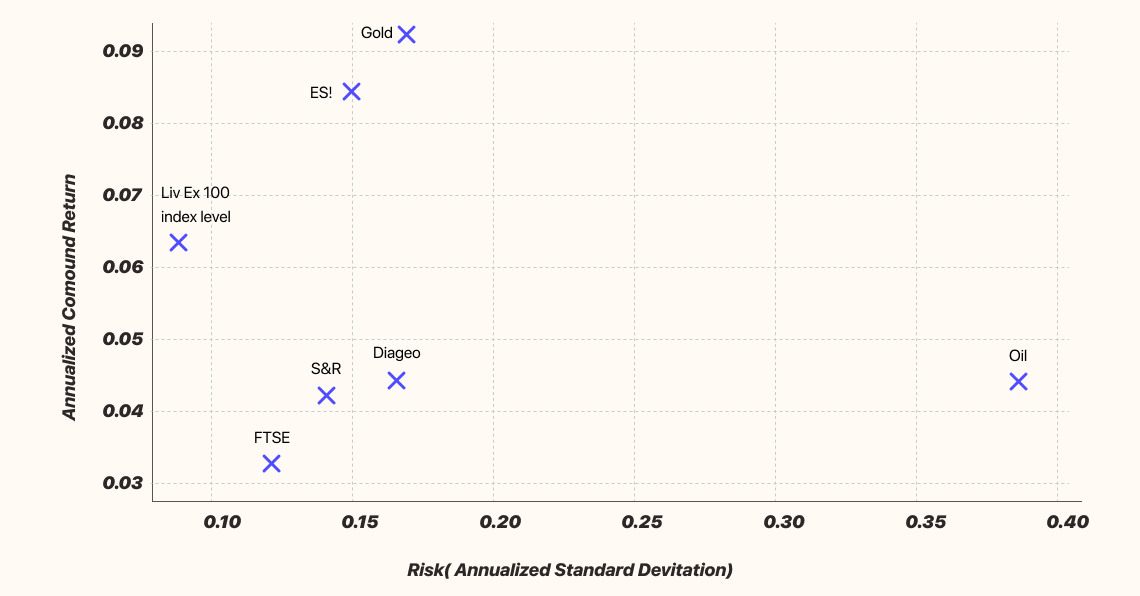
Volatility
The volatility (annualized standard deviation of returns) indicates the risk associated with each index or asset.
| Liv Ex 100 |
1 |
0.71 |
0.879 |
0.694 |
0.597 |
0.343 |
0.418 |
0.772 |
| ES! |
0.71 |
1 |
0.752 |
0.788 |
0.897 |
-0.014 |
0.765 |
0.874 |
| Gold |
0.879 |
0.752 |
1 |
0.622 |
0.564 |
0.274 |
0.423 |
0.756 |
| FTSE |
0.694 |
0.788 |
0.622 |
1 |
0.903 |
0.15 |
0.616 |
0.831 |
| S&P |
0.597 |
0.897 |
0.564 |
0.903 |
1 |
0.002 |
0.705 |
0.814 |
| Oil |
0.343 |
-0.014 |
0.274 |
0.15 |
0.002 |
1 |
-0.431 |
0.083 |
| DXY |
0.418 |
0.765 |
0.423 |
0.616 |
0.705 |
-0.431 |
1 |
0.64 |
| Diageo |
0.772 |
0.874 |
0.756 |
0.831 |
0.814 |
0.083 |
0.64 |
1 |
Key Insights:
- Liv
Ex 100 shows a relatively strong correlation with Gold and Diageo, suggesting these assets move in a somewhat similar
direction.
- Oil has
the lowest correlation with the other indices, indicating it behaves quite
independently.
- Oil also has the highest volatility, making it the most volatile asset among
those listed.